Top of main content

India Economics: Slashing tariffs, seeking FDI

24 Mar 2025

Key takeaways

  • The combination of high import tariffs and low FDI in mid-tech sectors has hurt India’s export potential over the past decade.
  • One positive from the potential US trade tariffs is that they could become a catalyst for change, but reforms must run deep.
  • The experience of China, ASEAN, and India’s own success with services exports could shed light along the way.

Too many uncertainties on the external front will likely hurt India’s GDP growth in the short term. But can these be turned into opportunities in the medium term? We go back in history to see what has worked in the past, and what has not. We analyse India’s economy over two periods –the ‘high growth’ decade, FY01-FY10, when India’s growth soared, alongside rising global export share and investment; and the ‘lower growth’ decade, FY11-FY20, when all three softened. How can India escape‘lower growth’ and ascend to ‘high growth’?

One key differentiating factor between the two periods was import tariffs, falling in the former, but rising in the latter. In fact, India’s import tariffs are amongst the highest globally, and were hurting exports even before the Trump administration put them centrestage. How have high tariffs hurt India? The economy has not fully plugged into global supply chains. One reason why China could raise its exporting strength (or its forward participation) was because it was open to importing (raising backward participation) before it became self-sufficient. Protectionist tendencies in India may have led to a premature clamping down of backward participation, hurting its export potential.

India’s FDI story also sheds light. After soaring in the pandemic period, high-tech FDI has fallen, as global competition has picked up. What India seems to have overlooked is mid-to-low tech FDI in labour intensive manufacturing sectors like food, apparel, furniture, and toys, which stagnated in the ‘lower growth’ period. In fact, India did not gain as much as ASEAN in these sectors during the first Trump Presidency. But if supply chains are rejigged during the second Trump Presidency, following higher tariffs on current large exporters, and the world looks for new producers, India may get a second chance. If sectors such as electronics, apparel, furniture, and footwear, where Vietnam made significant progress in the first Trump Presidency, is a reflection of where global opportunities from supply rejigging lie, it is worth noting that India is already a player, with room to grow. Incidentally, China’s excess capacity is not as large in these mid-to-low tech sectors. Space for another manufacturer may well be there.

But first India needs to make changes. And there is good news here. Potential US tariffs may have become a catalyst for reforms –lowering import tariffs, opening up to regional FDI, fast-tracking trade deals, and making the INR more flexible. And India does not have to look too far for models to emulate. Its success in services exports has demonstrated the power of moving up the value chain, from basic (e.g. call centre services) to high-tech (professional services). But for similar success in goods trade,reforms must run deep.

Certainly uncertain

Short-term pain from external uncertainties is inevitable

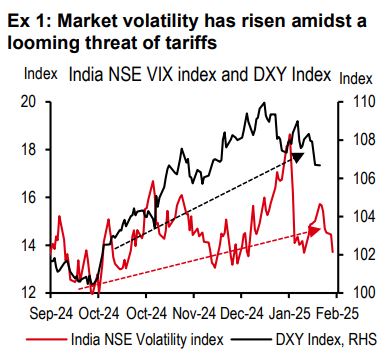
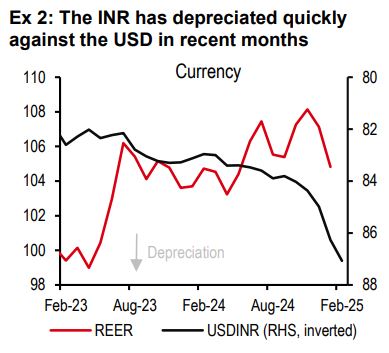
There are too many uncertainties on the external trade and tariffs front (see exhibits 1 and 2). Higher tariffs on India’s exports will likely lower its GDP growth directly (for instance, as we discuss later, reciprocal tariffs could lower India’s GDP growth by about 0.3ppt), and indirectly (for instance via lowering global FDI flows). In this report, however, we look beyond the immediate impact, and how this adverse shock can be turned into an opportunity. After all, in the past India has reformed best in periods of crisis (a la 1991). 

But can it be turned into a medium-term opportunity?

We go back into history to understand what worked in the past, and what has not. We analyse India’s economy and its external finances over various periods, and a few lessons are clear. If India can dare to be different by opening up for business by lowering tariff and non-tariff barriers, and be more welcoming of regional FDI in labour-intensive sectors, even as the world is turning more protectionist, it could more meaningfully plug into global value chains, and in the process create more jobs and growth.

India may have already embarked on this journey, but success will depend on how far it is ready to go. Let us elaborate.

Source: Bloomberg, HSBC
Source: CEIC, HSBC

Going back in history

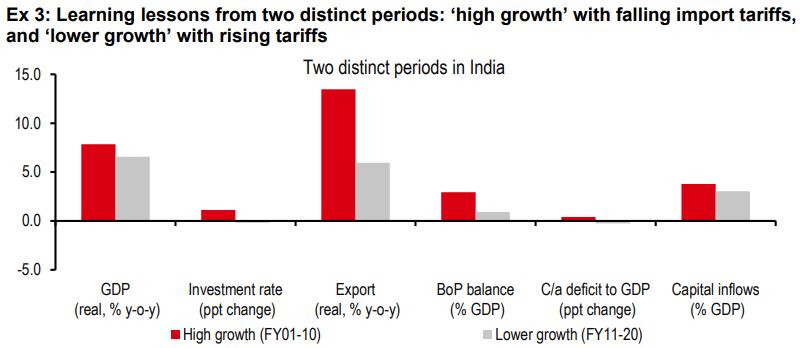
Two distinct periods in India show good insights: FY01-FY10 and FY11-FY20 (see exhibit 3).

Growth was high in FY01-FY10, when import tariffs were being cut

High growth FY01-FY10: This period showed high GDP growth (averaging 7.8% per year), rising investment (by 1.1% of GDP per year), and strong export growth (13% per year in real terms). India’s global export share more than doubled in this decade.

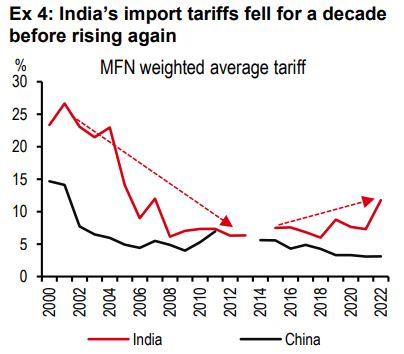
This was a period when India was cutting import tariffs (even bringing them down to where China’s tariffs were by 2010, see exhibit 4). There were high imports too, leading to a worsening of the c/a balance (by 0.3% of GDP per year). But because growth was strong, so were capital inflows. The c/a deficit was easily funded, leaving behind a high BoP surplus (2.9% of GDP).

Lower growth FY11-FY20: The next decade was quite the opposite. GDP growth was lower (average 6.6% per year), investment weaker (falling by 0.2% of GDP per year), and export growth softer (6% per year). India’s global export share was broadly stagnant in this period.

Growth slowed in FY11-FY20, when import tariffs were being raised

This was a period when India’s import tariffs stopped falling, and even started to rise from 2018 onwards (see exhibit 4). Imports were low too, leading to an improvement in the c/a balance (of 0.3% of GDP). But because the growth prospects were weaker, capital inflows were softer, leaving behind a smaller BoP surplus (0.9% of GDP).

What is clear from these periods is that high growth is a function of strong investment and export, and has been experienced best at times of falling import tariffs. The worsening of the c/a balance during the higher growth period has not been a problem, because it was fully funded by higher capital inflows.

The challenge for India is to break out of the ‘lower growth’ track, and ascend to ‘high growth’. What can it do right? 

Source: CEIC, Bloomberg, RBI, HSBC
Source: World Integrated Trade Solution, HSBC
Source: UNCTAD, HSBC

Are import tariffs too high?

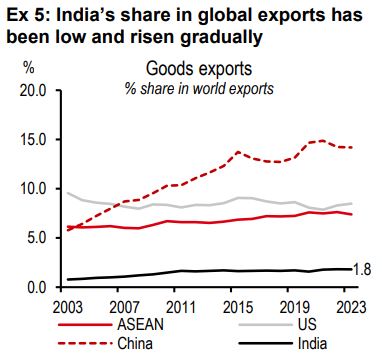
India’s share in global merchandise exports has been low and sluggish (see exhibits 5 and 6).

The obvious next question is why? Although global liquidity was lower in the ‘lower growth’ period than the ‘high growth’ period, all countries should have suffered. Why did India’s export share stagnate? There could be many reasons, such as the hurdles around the ease of doing business and quality of infrastructure, but what stands out for us in the current environment is elevated tariffs.

India has amongst the highest import tariffs ...

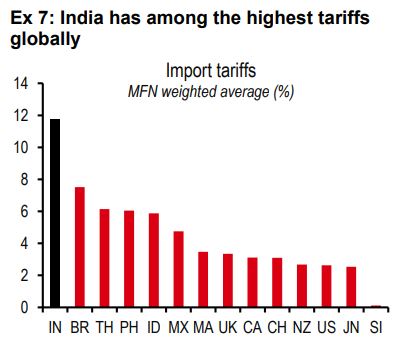
India has had amongst the highest import tariffs (see exhibit 7), and they have been on the rise (see exhibit 4, although this does not include some cuts in the recent budgets). Non-tariff barriers are also rife (although harder to quantify). WTO data shows that India ranked second after China in imposing antidumping measures against the US. Quality control orders (QCOs) are also on the rise (from 14 notified in 2014 to 186 notified in 2024). These orders are quality standards imposed on imports. They are meant to ensure quality and safety, but can also double up as non-tariff barriers. 

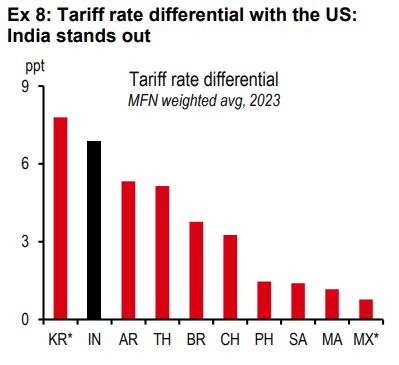
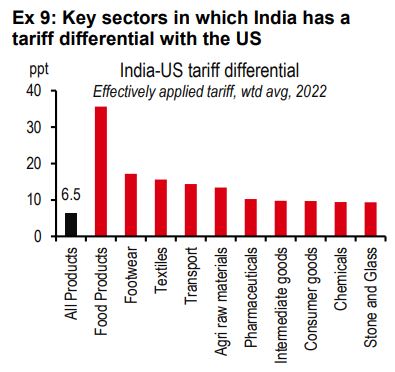
India’s high tariff and non-tariff barriers have begun to stand out at a time when President Trump has suggested reciprocal tariffs on India’s exports (see exhibit 8), although it is not clear what form reciprocal tariff increases will take, or the likely timeline. Going by the tariff differential with the US, the sectorsmost impacted could be agriculture, automobiles, jewellery, and pharmaceutical products (see exhibit 9). 

...which have been hurting exports, even before the Trump administration put them in limelight

All said, these tariff barriers were already hurting India, even before the Trump administration brought them centre stage. Next, we explore how exactly India has been hurt by high tariffs by undertaking a comparative assessment of India and China in trade integration.

Source: CEIC, HSBC
Source: World Integrated Trade Solution, HSBC
Source: World Integrated Trade Solution, Peterson Institute for International Economics, HSBC. Note CH refers to mainland China and is a trade-weighted average computed by PIIE. WITS data is MFN weighted average. The most recent round of tariff escalation in February 2025 is omitted. *FTA with the US
Source: World Integrated Trade Solution, HSBC

India’s still-low integration in the global goods value chains

India’s integration with global value chains has been low

Our India and China analysis uses OECD’s trade in value added (TiVA) database, which helps understand how economies have become integrated into global value chains over time.

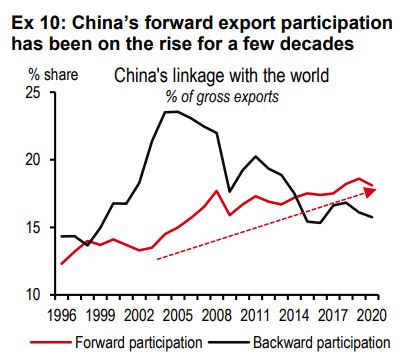
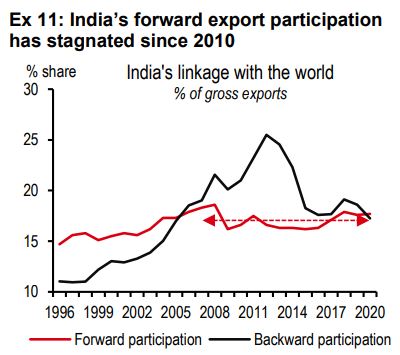
We use two concepts, backward and forward participation, both expressed as a share of an economy’s gross exports. Backward participation refers to the use of foreign-sourced inputs to produce a country’s exports, and forward participation refers to the use of domestically produced value-added in a foreign countries’ exports.

In the case of China, the forward participation has been on the rise for a few decades, making more countries dependent on Chinese produce (see exhibit 10). No surprise that China’s global export share has continued to rise.

An important enabler in the process was falling tariffs throughout the period, and higher imports, at least initially. China’s backward participation shows that the reliance on imported inputs increased for several years, before China deepened its manufacturing and became more self-sufficient.

Protectionism may have made imports costly, eventually hurting exports

In the case of India, we go back to the ‘high growth’ and ‘lower growth’ periods referred to above. Forward participation was rising until about 2010, after which it stagnated (see exhibit 11). Backward participation increased in the ‘high growth’ period, but declined in the ‘lower growth’ period, when import tariffs began to rise. The high tariffs may have made it costly to import, and given that the intermediary inputs industry had not developed by then, India’s forward participation, or more broadly, itsexport potential, suffered. 

India may have become a victim of premature protectionism. But this can now change, and there are some nascent signs (more later).

Source: OECD, HSBC
Source: OECD, HSBC

India’s FDI mystery

Having analysed trends in external trade, we move to its funding counterpart, i.e. foreign direct investment (FDI). What’s gone on there?

Net FDI into India increased appreciably in the five years before the pandemic (from USD22bn in FY14 to USD31bn in FY19). During the pandemic it increased further (to USD44bn in FY21).

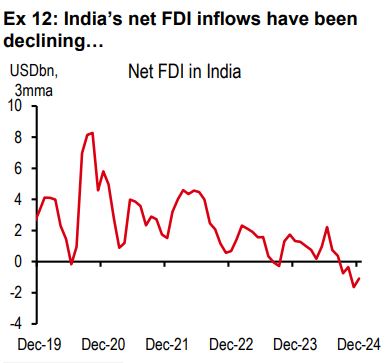
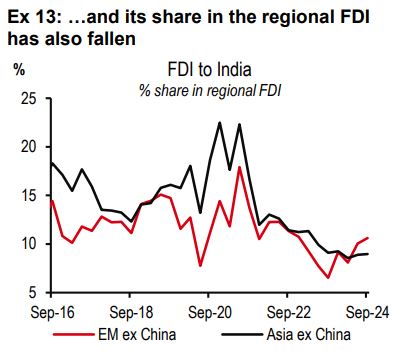
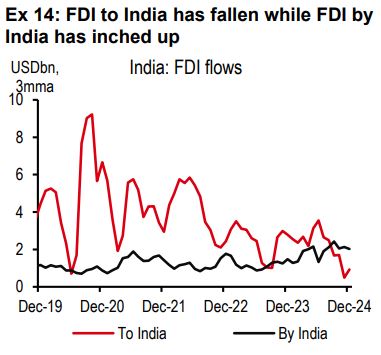
Thereafter net FDI has been declining sharply, now to about USD3.5bn (sum of the past four quarters, see exhibit 12). India’s share in regional FDI has also declined (exhibit 13). Which parts of FDI flows have led to this?

To recap the definitions: Net FDI: FDI to India –FDI by India; FDI to India: Gross FDI –repatriation.

After rising for a few years, high-tech FDI has been falling ...

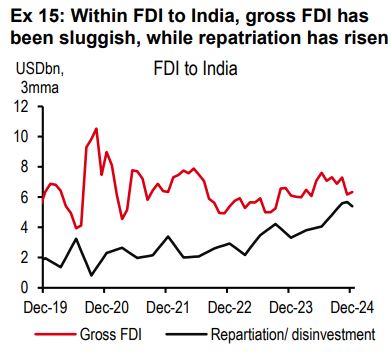
We find that FDI to India has fallen while FDI by India has inched up (see exhibit 14). And within FDI to India, gross FDI has been sluggish, and repatriation has risen(see exhibit 15). 

The rise in repatriation is not too great a concern in our view, as it is largely secondary sales and IPOs by MNCs as well as exits by PE firms, and perhaps adds to investor confidence that investing in India can be profitable.

What bothers us is that gross FDI has been more sluggish than one may have expected given India’s strong growth potential in the few years following the pandemic.

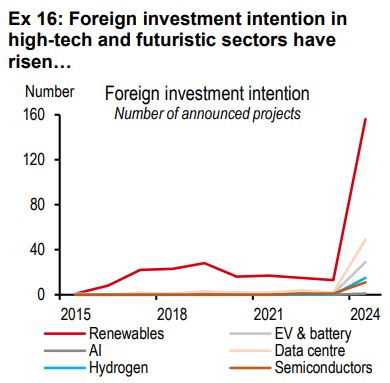
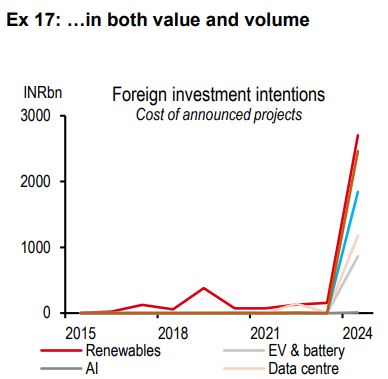
The mystery thickens when we find that throughout this period, foreign investment intention in high-tech and futuristic sectors such as renewables, semiconductors, green hydrogen, and data centres was strong (see exhibit 16 and 17). Some of this pledged money never came.

...as competition for funds in futuristic sectors has risen

Looking closer we find that much of the FDI instead went to advanced economies, in several instances where large government incentives made it attractive. In fact, 23% of global FDI in 2023 went to the US alone.

Source: CEIC, RBI, HSBC
Source: CMIE, HSBC
Source: CMIE, HSBC

A case of missing mid-to-low tech FDI

Meanwhile, mid-to-low tech FDI in labour intensive sectors remains weak...

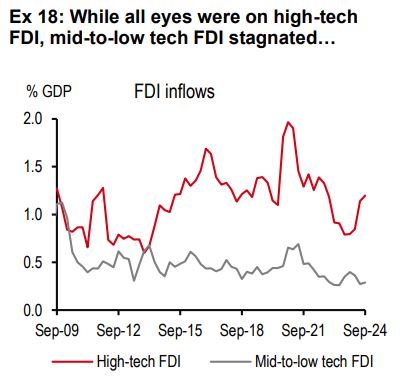
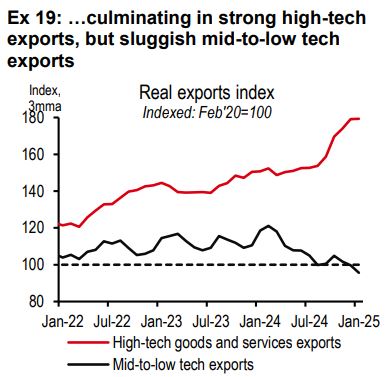
Our constructed indices show that much of the FDI boost in the pandemic period was led by high-tech sectors such as autos/EVs, electronics, pharmaceuticals, and computer services (see exhibit 18)[@india-economics-01-01]. This FDI culminated in strong growth in high-tech exports (see exhibit 19). And it is this FDI segment that declined in recent quarters given the fierce global competition (as other economies, some with deeper pockets to give subsidies, are competing for the same funds).

While high-tech FDI is critical for growth, what seems to have been overlooked is the other half –mid-to-low tech FDI. This includes foreign investment that fuels the more labour intensive sectors such as food, textiles, furniture, and toys. This has stagnated in the ‘weaker growth’ period (falling from 40% of overall FDI in 2000-10 to 30% in 2011-17, and further to 25% in 2018-24). 

...hurting labour intensive exports

No surprise that India’s mid-to-low tech exports have also been weak.

Source: CEIC, HSBC
Source: CEIC, HSBC

Lessons learnt from the first Trump Presidency

India did not benefit much when supply chains were rejigged following the first Trump administration

As a result of elevated tariffs and soft mid-to-low tech FDI, we believe India was not able to fully seize the opportunities in the first Trump Presidency, when supply chains were rejigged following the imposition of new and elevated tariffs. 

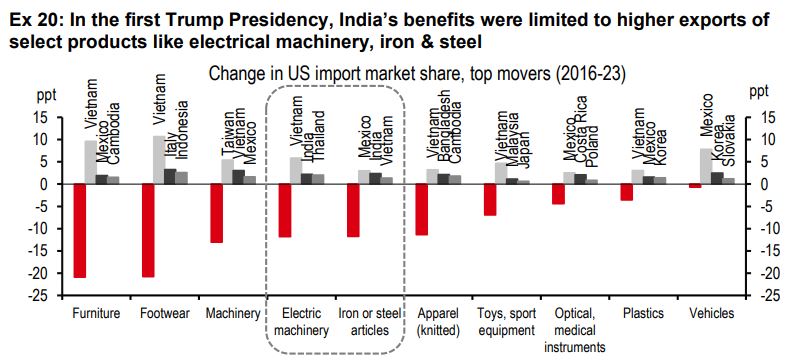
Did India benefit at all? Yes, but narrowly. It did gain market share in the export of electronics and iron & steel articles (see exhibit 20). But it was not able to gain significant market share in most other sectors, largely mid-tech (e.g. furniture, footwear, apparel, and toys), as well as some high-tech (e.g. machinery, instruments, and vehicles).

ASEAN was a key beneficiary then

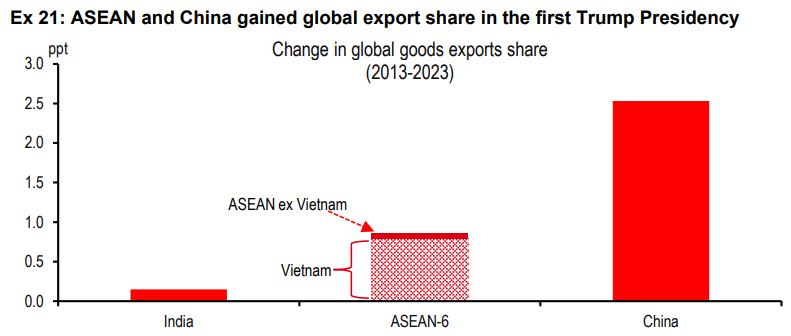
Other blocks like ASEAN made more progress in raising their global export share (see exhibit 21). Vietnam, in particular, made substantial gains in both mid-to-low tech and high-tech sector exports.

If supply chains are rejigged again during the second Trump administration, India may have a chance to grow. If the sectors where Vietnam made most progress during the first Trump administration is a reflection of where global opportunities from supply rejigging lie, note that India is already a player in these sectors.

India’s export basket suggests that it could potentially benefit this time around...

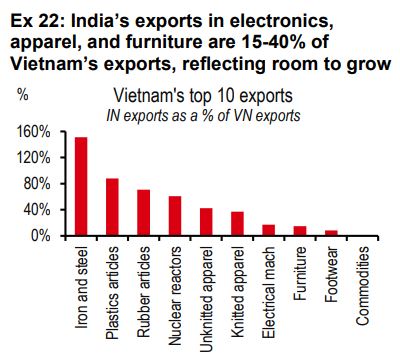
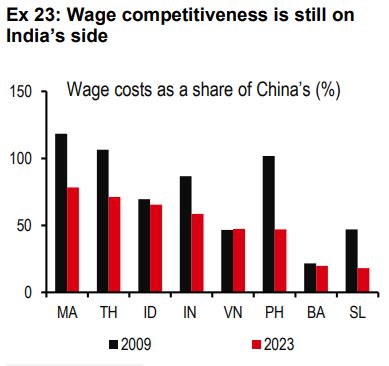
India’s exports in sectors like electronics, apparel, furniture, and footwear are 15-40% of Vietnam’s exports (see exhibit 22). This shows that India’s footprint is large enough to show capability, but with room to grow. After all, wage competitiveness is still on India’s side (see exhibit 23). But what does India need to do right this time around? 

Source: USA Trade Online, HSBC. Note: Data analysed at the HS2 digit level
Source: UNCTAD, HSBC
Source: ITC trademap, HSBC
Source: JETRO, CEIC, HSBC

Overcoming obstacles: US tariffs and China’s excess capacity

...if it can overcome two obstacles

There are two obstacles for India to overcome before it can increase goods manufacturing and exports –the potential US tariffs under the second Trump Presidency and China’s excess capacity. Let’s address both:

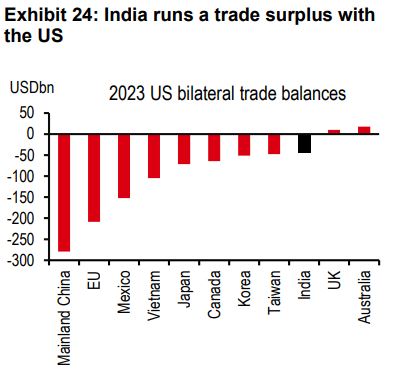
US tariffs. India stands out because of its trade surplus with the US (see exhibit 24). Back of the envelope estimates show that reciprocal tariffs could shave off growth by 0.3ppt (although there are many uncertainties around the details)[@india-economics-01-02]. And then there are plans to impose a 25% tariff on pharma and iron and steel products, which could hurt exports further. 

It is already lowering import tariffs and taking other open-for-business steps

But these threats could also become a catalyst for India to change a few things that kept it from becoming a larger manufacturing nation. In fact, it is already changing course on several fronts, becoming more ‘open for business’.

  • Lowering import tariffs: Some key tariffs were reduced recently. In the February budget, import tariffs were cut for items like high-end motorcycles, smartphone components, solar cells, and chemicals. Recent news articles show that the government plans to cut tariffs for several other goods such as automobiles, agricultural products, chemicals, pharmaceuticals, and medical devices[@india-economics-01-03].
  • Opening up to regional FDI: The economic survey of July 2024, which is an important policy document, made a case for India to become more open to regional FDI, in particular from China[@india-economics-01-04]. However, this has not culminated in higher FDI inflows yet.
  • Fast tracking bilateral trade deals: India plans to sign a bilateral trade agreement with the US by late 2025[@india-economics-01-05]. Reports suggest that it plans to buy more oil and defence equipment from the US and increase cooperation in nuclear energy. All of these will likely reduce India’s trade surplus with the US. It has also shown signs of wanting to fast track its trade agreement discussions with other regions such as the EU[@india-economics-01-06].
  • Making the INR more flexible: The currency’s 4% depreciation against the dollar over the last few months, and likely flexibility going forward,could help make exports competitive, and give manufacturers the confidence to set up and export from India.
The challenge will be to continue with these reforms

As supply chains become rejigged once again, as they did during the first Trump Presidency, and the world looks for new countries to manufacture from, India may have an opportunity to grow its manufacturing sector and exports.

China’s excess capacity: Another concern would be the challenge of growing exports at a time of excess capacity in China.

China has excess capacity in some sectors; mid-to-low tech consumer goods may not be one of them...

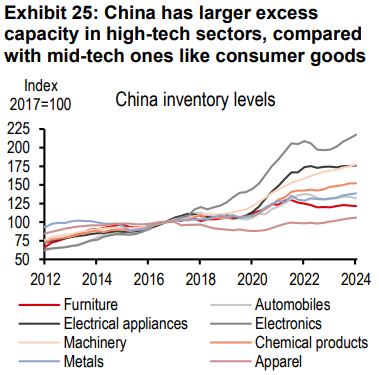
Here, we find that while China may have overcapacity in some sectors like electronics, electrical appliances, and automobiles, the same may not be true for other sectors, like furniture, apparel, and chemical products (see exhibit 25).

In fact, ASEAN has shown that growing export share despite Chinese overcapacity is possible. Its trade balance is better than pre-pandemic levels for several consumer manufactured goods. Therefore, we believe there are opportunities to grow, despite excess capacity in some pockets. 

...implying that space for another manufacturer exists
Source: Census.gov, HSBC
Source: Macrobond, HSBC

Why manufacturing should learn from services

India’s success in services exports show the importance of gradually moving up the value chain

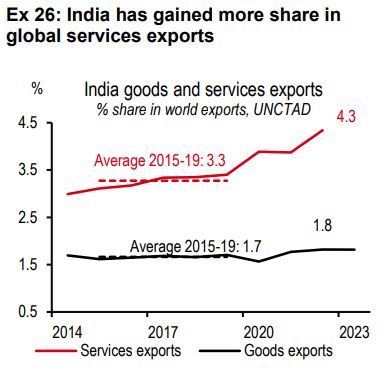
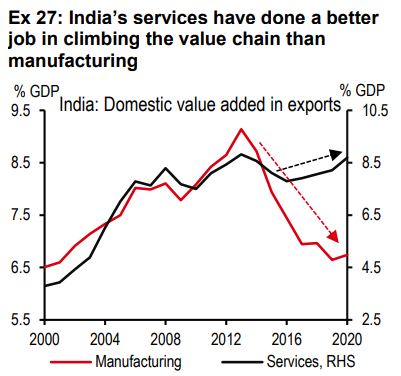
India’s services have done a better job in climbing the value chain than manufacturing (see exhibit 26 and 27). From a focus on call centres in the 1990s, to software solutions in the early 2000s, it is now a seller of complex professional services.

In the case of manufacturing, India may have tried to jump directly to high-tech without first going through low and mid-tech.

It is time to replicate that learning for goods manufacturing

This is not to lower the importance of high-tech manufacturing. It is more to say that lessons from low and mid-tech manufacturing can make India an even better high-tech manufacturer.

All said, we do not want to underestimate the challenges of navigating a world with rising protectionism and excess capacity. But we believe that if India remains focussed on being ‘open for business’, it could benefit from supply chain rejigging in response to tariffs on key exporters.

Source: UNCTAD, HSBC
Source: OECD, HSBC

Related Insights

Uncertainty around US tariffs continues…[11 Mar]
In recent weeks, the introduction and threats of US tariffs…[11 Feb]
India announced tax cuts to support consumption, held on to its capex thrust, and yet...[5 Feb]

Disclosure appendix

Additional disclosures

1. This report is dated as at 21 March 2025.

2. All market data included in this report are dated as at close 03 March 2025, unless a different date and/or a specific time of day is indicated in the report.

3. HSBC has procedures in place to identify and manage any potential conflicts of interest that arise in connection with its Research business. HSBC's analysts and its other staff who are involved in the preparation and dissemination of Research operate and have a management reporting line independent of HSBC's Investment Banking business. Information Barrier procedures are in place between the Investment Banking, Principal Trading, and Research businesses toensure that any confidential and/or price sensitive information is handled in an appropriate manner.

4. You are not permitted to use, for reference, any data in this document for the purpose of (i) determining the interest payable, or other sums due, under loan agreements or under other financial contracts or instruments, (ii) determining the price at which a financial instrument may be bought or sold or traded or redeemed, or the value of a financial instrument, and/or (iii) measuring the performance of afinancial instrument or of an investment fund.

Disclaimer

This document is prepared by The Hongkong and Shanghai Banking Corporation Limited (‘HBAP’), 1 Queen’s Road Central, Hong Kong. HBAP is incorporated in Hong Kong and is part of the HSBC Group. This document is distributed by HSBC Continental Europe, HBAP, HSBC Bank (Singapore) Limited, HSBC Bank (Taiwan) Limited, HSBC Bank Malaysia Berhad (198401015221 (127776-V))/HSBC Amanah Malaysia Berhad (200801006421 (807705-X)), The Hongkong and Shanghai Banking Corporation Limited, India (HSBC India), HSBC Bank Middle East Limited, HSBC UK Bank plc, HSBC Bank plc, Jersey Branch, and HSBC Bank plc, Guernsey Branch, HSBC Private Bank (Suisse) SA, HSBC Private Bank (Suisse) SA DIFC Branch, HSBC Private Bank Suisse SA, South Africa Representative Office, HSBC Financial Services (Lebanon) SAL, HSBC Private banking (Luxembourg) SA and The Hongkong and Shanghai Banking Corporation Limited (collectively, the “Distributors”) to their respective clients. This document is for general circulation and information purposes only. This document is not prepared with any particular customers or purposes in mind and does not take into account any investment objectives, financial situation or personal circumstances or needs of any particular customer. HBAP has prepared this document based on publicly available information at the time of preparation from sources it believes to be reliable but it has not independently verified such information. The contents of this document are subject to change without notice. HBAP and the Distributors are not responsible for any loss, damage or other consequences of any kind that you may incur or suffer as a result of, arising from or relating to your use of or reliance on this document. HBAP and the Distributors give no guarantee, representation or warranty as to the accuracy, timeliness or completeness of this document. This document is not investment advice or recommendation nor is it intended to sell investments or services or solicit purchases or subscriptions for them. You should not use or rely on this document in making any investment decision. HBAP and the Distributors are not responsible for such use or reliance by you. You should consult your professional advisor in your jurisdiction if you have any questions regarding the contents of this document. You should not reproduce or further distribute the contents of this document to any person or entity, whether in whole or in part, for any purpose. This document may not be distributed to any jurisdiction where its distribution is unlawful. The following statement is only applicable to HSBC Bank (Taiwan) Limited with regard to how the publication is distributed to its customers: HSBC Bank (Taiwan) Limited (“the Bank”) shall fulfill the fiduciary duty act as a reasonable person once in exercising offering/conducting ordinary care in offering trust services/business. However, the Bank disclaims any guaranty on the management or operation performance of the trust business.

The following statement is only applicable to by HSBC Bank Australia with regard to how the publication is distributed to its customers: This document is distributed by HSBC Bank Australia Limited ABN 48 006 434 162, AFSL/ACL 232595 (HBAU). HBAP has a Sydney Branch ARBN 117 925 970 AFSL 301737.The statements contained in this document are general in nature and do not constitute investment research or a recommendation, or a statement of opinion (financial product advice) to buy or sell investments. This document has not taken into account your personal objectives, financial situation and needs. Because of that, before acting on the document you should consider its appropriateness to you, with regard to your objectives, financial situation, and needs.

Important Information about the Hongkong and Shanghai Banking Corporation Limited, India (“HSBC India”)

HSBC India is a branch of The Hongkong and Shanghai Banking Corporation Limited. HSBC India is a distributor of mutual funds and referrer of investment products from third party entities registered and regulated in India. HSBC India does not distribute investment products to those persons who are either the citizens or residents of United States of America (USA), Canada or New Zealand or any other jurisdiction where such distribution would be contrary to law or regulation.

Mainland China

In mainland China, this document is distributed by HSBC Bank (China) Company Limited (“HBCN”) and HSBC FinTech Services (Shanghai) Company Limited to its customers for general reference only. This document is not, and is not intended to be, for the purpose of providing securities and futures investment advisory services or financial information services, or promoting or selling any wealth management product. This document provides all content and information solely on an "as-is/as-available" basis. You SHOULD consult your own professional adviser if you have any questions regarding this document.

The material contained in this document is for general information purposes only and does not constitute investment research or advice or a recommendation to buy or sell investments. Some of the statements contained in this document may be considered forward looking statements which provide current expectations or forecasts of future events. Such forward looking statements are not guarantees of future performance or events and involve risks and uncertainties. Actual results may differ materially from those described in such forward-looking statements as a result of various factors. HSBC India does not undertake any obligation to update the forward-looking statements contained herein, or to update the reasons why actual results could differ from those projected in the forward-looking statements. Investments are subject to market risk, read all investment related documents carefully.

© Copyright 2025. The Hongkong and Shanghai Banking Corporation Limited, ALL RIGHTS RESERVED.

No part of this document may be reproduced, stored in a retrieval system, or transmitted, on any form or by any means, electronic, mechanical, photocopying, recording or otherwise, without the prior written permission of The Hongkong and Shanghai Banking Corporation Limited.

Important information on sustainable investing

“Sustainable investments” include investment approaches or instruments which consider environmental, social, governance and/or other sustainability factors (collectively, “sustainability”) to varying degrees. Certain instruments we include within this category may be in the process of changing to deliver sustainability outcomes. There is no guarantee that sustainable investments will produce returns similar to those which don’t consider these factors. Sustainable investments may diverge from traditional market benchmarks.

In addition, there is no standard definition of, or measurement criteria for sustainable investments, or the impact of sustainable investments (“sustainability impact”). Sustainable investment and sustainability impact measurement criteria are (a) highly subjective and (b) may vary significantly across and within sectors.

HSBC may rely on measurement criteria devised and/or reported by third party providers or issuers. HSBC does not always conduct its own specific due diligence in relation to measurement criteria. There is no guarantee: (a) that the nature of the sustainability impact or measurement criteria of an investment will be aligned with any particular investor’s sustainability goals; or (b) that the stated level or target level of sustainability impact will be achieved.

Sustainable investing is an evolving area and new regulations may come into effect which may affect how an investment is categorised or labelled. An investment which is considered to fulfil sustainable criteria today may not meet those criteria at some point in the future.