Top of main content
India Economics: India’s K-shaped inflation

28 Jun 2024

Key takeaways

  • The same developments driving a K-shaped recovery seem to be driving K-shaped inflation dynamics.
  • Indeed, food inflation is outstripping core, rural outdoing urban, goods more than services, and input prices higher than output.
  • With supply shocks becoming more frequent, monetary policymaking and reforms may need to adjust.

While the K-shaped growth recovery debate has been raging for a while, many have missed the K-shaped price dynamics. There are different ways to slice the inflation data, and across most of them, one part of inflation is rising while the other is falling (see report for details). Perhaps inflation and growth dynamics were never meant to differ. The same shocks that are driving the variance in growth, like the pandemic and climate change, hurting some groups more than others, are also likely driving the variance in prices.

Let’s work with one example, the ongoing heat waves, which have made us realise that climate change is not just about uncertain rains, but also higher temperatures. It can be argued that crop damage and livestock mortality led to a rise infood prices as well as a loss in income for rural Indians, explaining the coexistence of higher food and lower core inflation. Where food imports were possible, prices did not go up much, leading to high but not too widespread food inflation. The government lent a helping hand by cutting several fuel prices, but many of those fuels are not commonly used in rural areas, like they are at urban centres, leading to rural inflation being much higher than urban.

With falling incomes, this group just about managed to afford necessary goods, keeping demand and price of services low, and explaining why goods inflation remains higher than services. Corporates facing weak demand did not raise prices, instead taking a hit on margins, and explaining why input inflationis outpacing output inflation.
And this is not just limited to weather shocks. We can apply the same reasoning to several others – the pandemic and global commodity price volatility. Such supply-side shocks that impact income and inflation faced by various groups differently, are becoming more frequent. And this will complicate policymaking. For instance, should the RBI, ruminating its next move, worry about the c5ppt wedge between food and core inflation, or should it take solace that headline inflation is the closest to target in several months?

There are no simple answers. Eventually the RBI may have to focus on the expected direction of change in the short run. For instance, if rains pick up, reservoirs fill back up, and sowing rises, eventually food inflation will soften. The RBI may find a little bit of room to ease later in the year, even if medium-term pressures from “recurring and overlapping” climate related events, as the RBI governor called them recently, remain. Meanwhile the government, too, may need to be more sensitive about the impact of policy changes across different groups already reeling under supply-side shocks. Reforms may need careful explaining and planning. Welcome to the brave new world.

We see inflation from various lenses, and it looks rather K-shaped. The divergence in the inflation faced by different groups is often times driven by the same shocks thatcreate disparities in their incomes. Some of these supply shocks include the pandemic, climate change, commodity prices shocks, and in certain cases can also include policy shocks.

Here we elaborate on India’s K-shaped inflation across various cuts:

Food versus core inflation

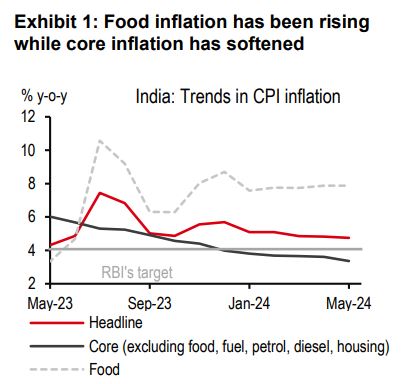
Over the past year, food inflation has been rising while core inflation has softened (Exhibit 1). The drivers of both have also seen a sea change.

Core inflation has fallen, led partly by Chinese disinflation and the RBI’s resolve

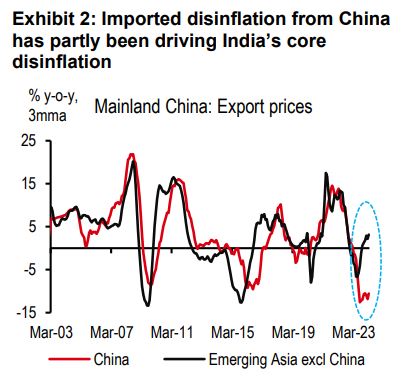
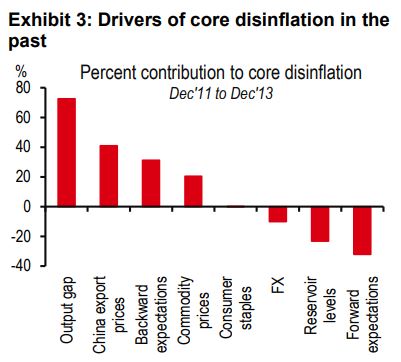
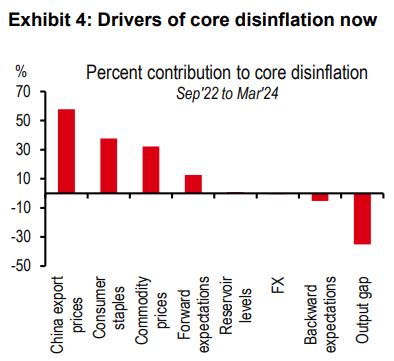
Let’s start with core inflation. We update our model, and it throws up some interesting new drivers of disinflation. One, during the last bout of core disinflation, the main driver was the output gap; while this time around it is imported disinflation from China (Exhibit 2).

Two, some normalisation in informal sector production (proxied by consumer staples production), after disruption in the pandemic period has also helped ease core price pressures this time around. This wasn’t amongst the drivers last time.

Three, in earlier times, past inflation was a driver of future inflation. If inflation was high, it would remain high for longer. Now future inflation expectations matter much more, and the belief that RBI’s hawkishness will keep inflation anchored around the 4% target has played a role in driving down core prices. In other words, inflation targeting seems to have had some of the desired results.

As long as the three factors remain supportive, core inflation is likely to remain under control (Exhibits3 and 4). The risk, in our view, is rising globalcommodity prices, already up 10% since the start of the year.

Source: CEIC, HSBC
Source: CPB, HSBC
Source: CEIC, HSBC calculations
Note: This is based on our core inflation model.Source: CEIC, HSBC calculations
Food prices have shot up, led by weak rains and heatwaves

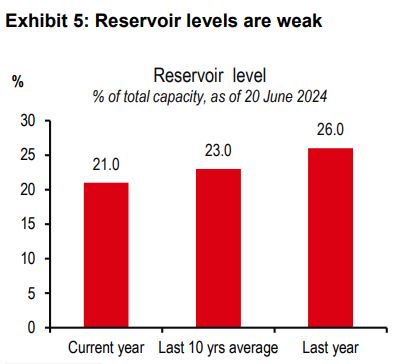
Food inflation remains a big worry. It has, in our view, been impacted by the changing nature of weather events. In the past, El Niño came with low rainfall, and the country’s obsession with following daily rains was well known.

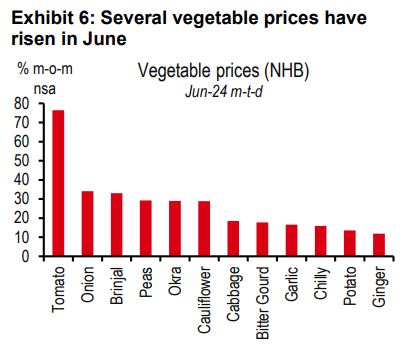
But now, it is not just about rains (Exhibit 5), but also high temperatures leading to an unprecedented heatwave over the past few months. This combination of low rains and high temperatures has impacted the price of:

  • Vegetables (for which prices have risen 27% y-o-y, Exhibit 6),
  • Wheat (for which the government’s open market sales to keep market prices down have been much higher than the regular public distribution for welfare schemes, and now global prices have risen back up making imports more expensive), and
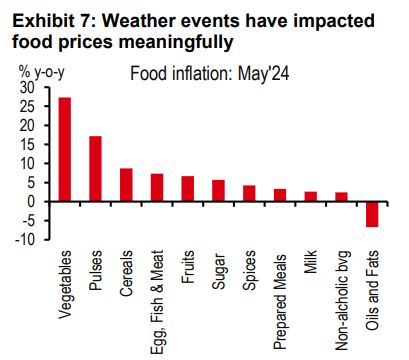
  • Pulses (for which despite large imports and open market sales, inflation is at 17% y-o-y, Exhibit 7).

And this is not where it ends. Livestock mortality has shot up as a result of the heatwaves, and is hurting the production of eggs, meat, and milk.

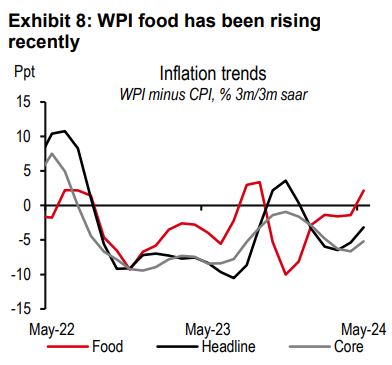
With WPI food rising recently, our worry is that CPI food inflation could tick higher overthe short run (Exhibit 8). And if rains don’t normalise over July and August, the resultant food stress of 2024 could arguably be worse than in 2023, given low stocks of wheat and pulses in the granaries.

Whether or not it rains in the next few weeks will determine RBI action

Will the weather turn? Rainfall is forecast to be above-normal in the season running from June to September 2024, as a La Niña is expected to develop over the next few months. In the past, La Niña has been associated with more rains and cooler temperatures.

But so far in June, rains remain 17% below normal with the Northwest region, which grows most of India’s cereal, at a c63% deficit. Whether or not rains increase over the next few weeks, and sowing activity, are likely to determine future inflation.

If, indeed, rains normalise, inflation could fall sharply and the RBI may be able to cut rates. This is our base case assumption and we forecast a shallow rate cutting cycle of 50bp, taking the repo rate from 6.5% now to 6% by March 2025. The risks are of no easing if rains do not pick up.

Source: CEIC, HSBC
Source: CEIC, HSBC
Source: CEIC, HSBC
Source: CEIC, HSBC

Depth versus spread of inflation

Higher food imports of someitems may have ensured that...

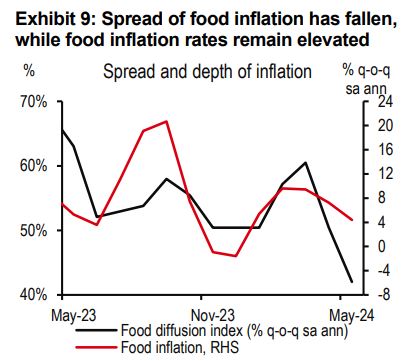
We have created a diffusion index that picks up the proportion of items where inflation is high, which we define as items where inflation has crossed the 4% mark. As such, it is a measure of the spread of inflation.

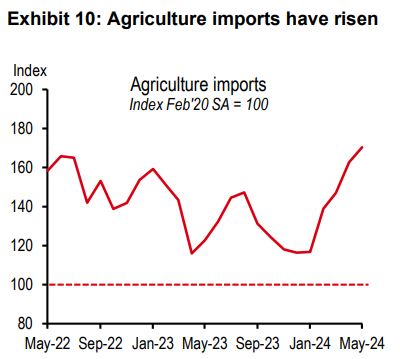
For the food basket, we find that the spread of inflation has fallen in recent months, even as overall inflation rates remain elevated (Exhibit 9). Less concentrated food inflation islikelytobe related to the fact that the country is importing a lot of food, as can be seen from a considerable rise in agricultural imports (Exhibit 10).

...the spread of inflation is not as worrisome as its depth

And on the margin we think this is good news. A high inflation problem across more food items would have been harder to solve.

Source: CEIC, HSBC
Source: CEIC, HSBC

Rural versus urban inflation

Rural inflation is higher than urban...

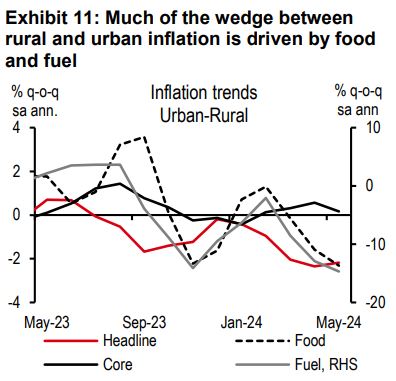
Rural inflation at 5.3% in May outstripped urban inflation by 1.1ppt. And we see much of this driven by the wedge in food and fuel inflation (Exhibit 11), even as there is no real wedge between rural and urban core inflation.

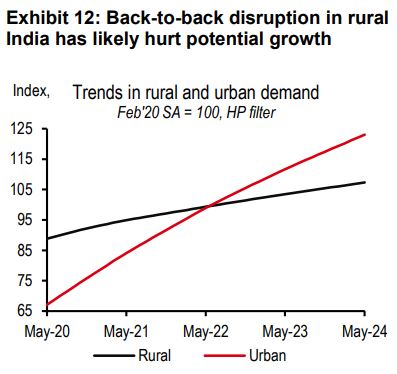
Let’s starts with core inflation. Ona sequential basis, it seems core inflation is the same in rural and urban India. One would like to think that rural core inflation should be lower than urban since rural economic growth has been slower. But back-to-back disruption in rural income also means that potential growth has arguably fallen and just with little growth, core inflation can remain high (Exhibit 12).

...led by peculiarities of rural India when it comes to fuel and food prices

Fuel inflation dynamics are different. The government cut the price of petrol, diesel,and LPG, each of which are consumed more in urban India. As such urban energy inflation fell more quickly than rural inflation.

Food inflation dynamics are most mysterious. One would think rural food inflation should be lower than urban food given rural India grows the food. But there are two hypotheses on why rural food prices remain so much higher:

One, with incomes hurt, farmers are making more effort to sell food to urban procurers where the return may be higher, leaving a shorter supply left back in rural areas.

Two, a higher proportion on food was imported this time around, and port-to-fork infrastructure is likely to be more efficient in urban India.

Source: CEIC, HSBC
Note: Based on our rural and urban activity indicator.Source: CEIC, HSBC

Input versus output inflation

Input prices are far outpacing output prices

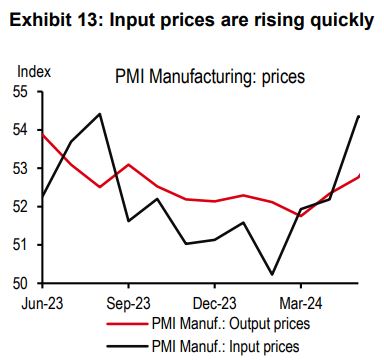
With higher food inflation, rising global oil and industrial metal prices, it is no surprise that input prices are rising quickly. But we notice that output prices are not rising as swiftly (Exhibit 13).

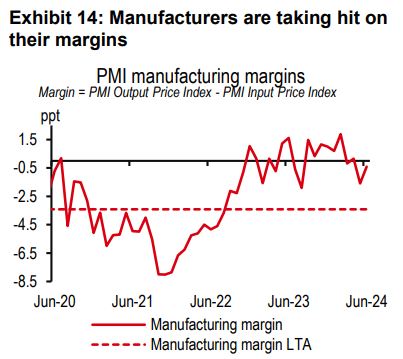
This means that manufacturers are not finding it prudent to pass on higher prices to consumers, perhaps because overall consumption demand is weak (partly weighed down by supply-side shocks).
Instead they are taking a hit on the margins (Exhibit 14).

Source: S&P Global PMI, HSBC

Goods versus services inflation

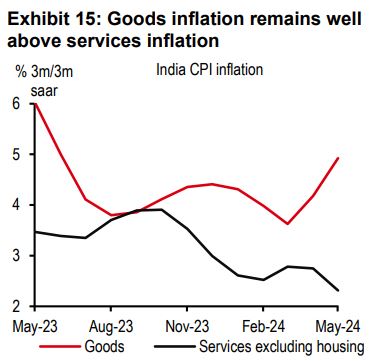
Goods inflation remains well above services inflation, indeed looking like a perfect K (Exhibit 15). It is worth noting here that India is amongst the few large economies where services inflation did not take off post-pandemic.

Goods demand and inflation havebeen running higher than services

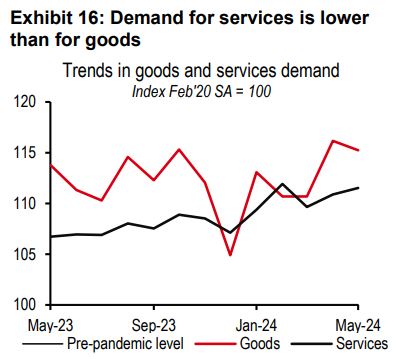
Again, we believe it’s all interlinked. Supply shocks that kept incomes weak (for instance high temperatures hurting rural demand), likely led to a situation where incomes were just about enough to afford the necessary goods. Demand for services and therefore the price of services remained low (Exhibit 16).

Source: CEIC, HSBC
Source: CEIC, HSBC

Related Insights

Global growth data is still ticking along, but there are early signs of labour markets…[11 Jun]
Inflation rates for both India and Indonesia have fallen in the past year, but on other...[22 May]
Economic activity remains solid, with global PMIs, retail sales and GDP growth faring well. [14 May]

Disclosure appendix

Additional disclosures

1. This report is dated as at 26 June 2024.

2. All market data included in this report are dated as at close 25 June 2024, unless a different date and/or a specific time of day is indicated in the report.

3. HSBC has procedures in place to identify and manage any potential conflicts of interest that arise in connection with its Research business. HSBC's analysts and its other staff who are involved in the preparation and dissemination of Research operate and have a management reporting line independent of HSBC's Investment Banking business. Information Barrier procedures are in place between the Investment Banking, Principal Trading, and Research businesses toensure that any confidential and/or price sensitive information is handled in an appropriate manner.

4. You are not permitted to use, for reference, any data in this document for the purpose of (i) determining the interest payable, or other sums due, under loan agreements or under other financial contracts or instruments, (ii) determining the price at which a financial instrument may be bought or sold or traded or redeemed, or the value of a financial instrument, and/or (iii) measuring the performance of afinancial instrument or of an investment fund.

Disclaimer

This document is prepared by The Hongkong and Shanghai Banking Corporation Limited (‘HBAP’), 1 Queen’s Road Central, Hong Kong. HBAP is incorporated in Hong Kong and is part of the HSBC Group. This document is distributed by HSBC Continental Europe, HBAP,HSBC Bank (Singapore) Limited, HSBC Bank (Taiwan) Limited, HSBC Bank Malaysia Berhad (198401015221 (127776-V))/HSBC Amanah Malaysia Berhad (200801006421 (807705-X)), The Hongkong and Shanghai Banking Corporation Limited, India (HSBC India), HSBC Bank Middle East Limited, HSBC UK Bank plc, HSBC Bank plc, Jersey Branch, and HSBC Bank plc, Guernsey Branch, HSBC Private Bank (Suisse) SA, HSBC Private Bank (Suisse) SA DIFC Branch, HSBC Private Bank Suisse SA, South Africa Representative Office, HSBC Financial Services (Lebanon) SAL, HSBC Private banking (Luxembourg) SA and The Hongkong and Shanghai Banking Corporation Limited (collectively, the “Distributors”) to their respective clients. This document is for general circulation and information purposes only. This document is not prepared with any particular customers or purposes in mind and does not take into account any investment objectives, financial situation or personal circumstances or needs of any particular customer. HBAP has prepared this document basedon publicly available information at the time of preparation from sources it believes to be reliable but it has not independently verified such information. The contents of this document are subject to change without notice. HBAP and the Distributors are not responsible for any loss, damage or other consequences of any kind that you may incur or suffer as a result of, arising from or relating to your use of or reliance on this document. HBAP and the Distributors give no guarantee, representation or warranty as to the accuracy, timeliness or completeness of this document. This document is not investment advice or recommendation nor is it intended to sell investments or servicesor solicit purchases or subscriptions for them. You should not use or rely on this document in making any investment decision. HBAP and the Distributors are not responsible for such use or reliance by you. You should consult your professional advisor in your jurisdiction if you have any questions regarding the contents of this document. You should not reproduce or further distribute the contents of this document to any person or entity, whether in whole or in part, for any purpose. This document may not be distributed to any jurisdiction where its distribution is unlawful.

The following statement is only applicable to HSBC Bank (Taiwan) Limited with regard to how the publication is distributed to its customers: HSBC Bank (Taiwan) Limited (“the Bank”) shall fulfill the fiduciary duty act as a reasonable person once in exercising offering/conducting ordinary care in offering trust services/business. However, the Bank disclaims any guaranty on the management or operation performance of the trust business. The following statement is only applicable to by HSBC Bank Australia with regard to how the publication is distributed to its customers: This document is distributed by HSBC Bank Australia Limited ABN 48 006 434 162, AFSL/ACL 232595 (HBAU). HBAP has a Sydney Branch ARBN 117 925 970 AFSL 301737.The statements contained in this document are general in nature and do not constitute investment research or a recommendation, or a statement of opinion (financial product advice) to buy or sell investments. This document has not taken into account your personal objectives, financial situation and needs. Because of that, before acting on the document you should consider its appropriateness to you, with regard to your objectives, financial situation, and needs.

Important Information about the Hongkong and Shanghai Banking Corporation Limited, India (“HSBC India”) HSBC India is a branch of The Hongkong and Shanghai Banking Corporation Limited. HSBC India is a distributor of mutual funds and referrer of investment products from third party entities registered and regulated in India. HSBC India does not distribute investment products to those persons who are either the citizens or residents of United States of America (USA), Australia or New Zealand or any other jurisdiction where such distribution would be contrary to law or regulation.

Mainland China In mainland China, this document is distributed by HSBC Bank (China) Company Limited (“HBCN”) and HSBC FinTech Services (Shanghai)Company Limited to its customers for general reference only. This document is not, and is not intended to be, for the purpose of providing securities and futures investment advisory services or financial information services, or promoting or selling any wealth management product. This document provides all content and information solely on an "as-is/as-available" basis. You SHOULD consult your own professional adviser if you have any questions regarding this document.

The material contained in this document is for general information purposes only and does not constitute investment research or advice or a recommendation to buy or sellinvestments. Some of the statements contained in this document may be considered forward looking statements which provide current expectations or forecasts of future events. Such forward looking statements are not guarantees of future performance or events and involve risks and uncertainties. Actual results may differ materially from those described in such forward-looking statements as a result of various factors. HSBC India does not undertake any obligation to update the forward-looking statements contained herein, or to update the reasons why actual results could differ from those projected in the forward-looking statements. Investments are subject to market risk, read all investment related documents carefully.

© Copyright 2024. The Hongkong and Shanghai Banking Corporation Limited, ALL RIGHTS RESERVED. No part of this document may be reproduced, stored in a retrieval system, or transmitted, on any form or by any means, electronic, mechanical, photocopying, recording or otherwise, without the prior written permission of The Hongkong and Shanghai Banking Corporation Limited.

Important information on sustainable investing “Sustainable investments” include investment approaches or instruments which consider environmental, social, governance and/or other sustainability factors (collectively, “sustainability”) to varying degrees. Certain instruments we include within this category may be in the process of changing to deliver sustainability outcomes. There is no guarantee that sustainable investments will produce returns similar to those which don’t consider these factors. Sustainable investments may diverge from traditional market benchmarks. In addition, there is no standard definition of, or measurement criteria for sustainable investments, or the impact of sustainable investments (“sustainability impact”). Sustainable investment and sustainability impact measurement criteria are (a) highly subjective and (b) may vary significantly across and within sectors.

HSBC may rely on measurement criteria devised and/or reported by third party providers or issuers. HSBC does not always conduct its own specific due diligence in relation to measurement criteria. There is no guarantee: (a) that the nature of the sustainability impact or measurement criteria of an investment will be aligned with any particular investor’s sustainability goals; or (b) that the stated level or target level of sustainability impact will be achieved. Sustainable investing is an evolving area and new regulations may come into effect which may affect how an investment is categorised or labelled. An investment which is considered to fulfil sustainable criteria today may not meet those criteria at some point in the future.